

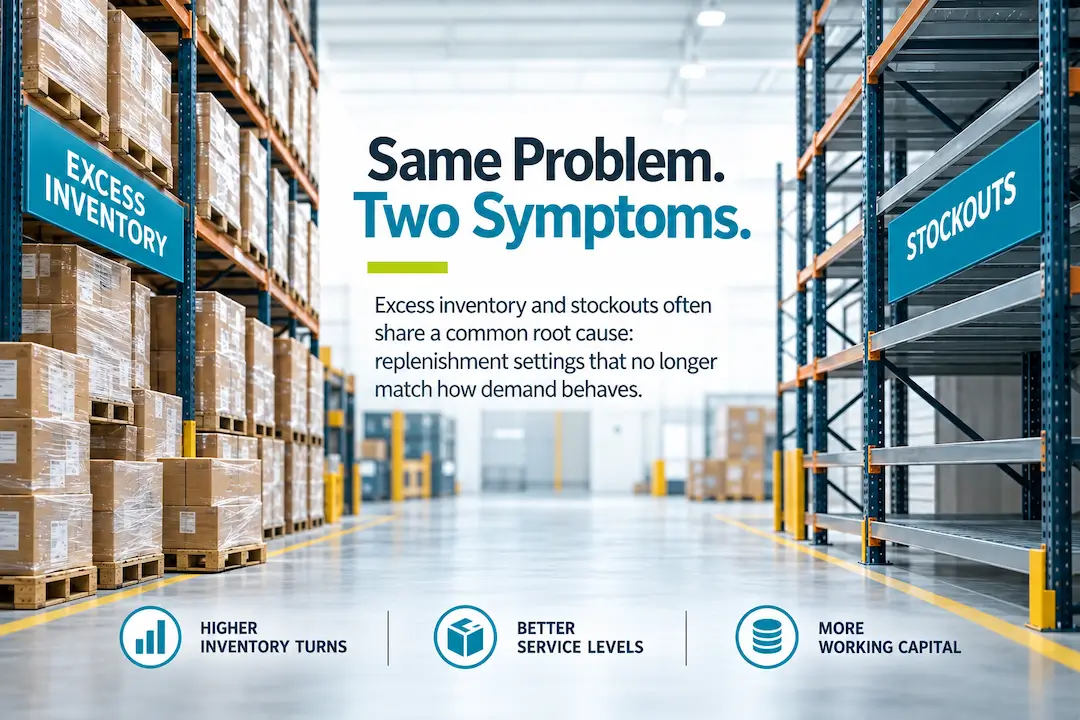
When a warehouse experiences both excess inventory and stockouts, the two issues often share a common root cause: replenishment settings that no longer match how demand behaves. Cutting inventory across the board makes service worse. Correcting parameters at the item level improves turns and service at the same time.
Every supply chain leader has had this conversation. Inventory is up. Service is down. Finance wants to know how both can be true at once, and the honest answer sounds like an excuse.
It is not an excuse. It is the single most reliable symptom of operational drift, and it has a specific mechanical cause.
How can a business hold too much inventory and still run out?
Because inventory is not one number. It is thousands of item-level positions, each governed by its own settings, and those settings were mostly configured once and never revisited.
The result is a portfolio that is badly distributed rather than badly sized. Cash sits in slow movers, obsolete variants and over-buffered items that were never going to stock out. Meanwhile the items customers actually order run thin, because their reorder points reflect a lead time that changed two supplier consolidations ago.
Aggregate inventory looks high. Aggregate service looks poor. Both are accurate, and neither tells you where the problem is.
A private equity backed aerospace manufacturer and MRO provider showed the pattern in its most acute form: high inventory coexisting with component shortages, planners padding promise dates because they did not trust the system, and poor visibility into actual work center capacity. Rebuilding the planning logic and enforcing Available to Promise discipline produced a 25% increase in inventory turns and opened a further $35M inventory reduction target.
Why does an across-the-board cut make it worse?
Because a percentage reduction applies the same instruction to items with completely different behavior.
An across-the-board cut reduces buffer indiscriminately, potentially creating shortages while failing to remove the idle inventory (Dead Stock) layer that exists beyond ongoing demand. Service degrades. Expedites rise. Premium freight consumes part of the cash that was released. Then the business panics and rebuys, usually with the same parameters that produced the original imbalance.
Twelve months later, inventory is back where it started, service is worse, and the organization has concluded that the tradeoff between working capital and service is fixed.
It is not fixed. It only appears fixed when the lever being pulled is volume rather than logic.
What actually produces the imbalance?
Four settings account for most of it.
- Safety stock calculated once. Usually with a single service level assumption applied across items with very different demand variability, so every item is buffered as though it behaves like the least predictable one.
- Lead times that no longer exist. The master data says four weeks. The supplier moved, consolidated, or changed lanes. Nobody updated the record, and the planning engine is solving for a reality that ended years ago.
- Lot sizing tuned for the wrong objective. Minimum order quantities and rounding values set for purchasing convenience or a lapsed volume discount, producing years of coverage on items that turn twice.
- Overrides that hardened into policy. A planner corrected the system once and was right. The correction became a habit; the habit became the business rule.
None of these are visible in an inventory report. All of them are visible in the data that produces one.
Does fixing this really improve both numbers?
Yes, and the published results are the argument.
Loparex, a global specialty release liner manufacturer, had implemented S/4HANA across four facilities and watched teams revert to legacy workarounds rather than use the new planning capability. Correcting master data settings and activating the planning functionality delivered a 39% reduction in inventory alongside a 24% increase in On Time In Full delivery, and a 96% reduction in supply chain exceptions and overdue elements.
Inventory down by more than a third. Service levels improved. At the same time.
A Fortune 500 energy and lubricants producer running on spreadsheet-dependent planning saw a $22 million reduction in average inventory and a 70% decrease in potential service level breakdowns.
The pattern holds because the two problems were never opposites. They were the same problem seen from two directions.
What this means for the supply chain leader
If you are being asked to reduce inventory and protect service simultaneously, and the only tools on the table are a target and a deadline, the program will fail in a predictable way and the failure will be attributed to the tradeoff rather than the method.
The productive move is to stop treating inventory as the number to manage and start treating it as the output it actually is. The manageable objects are the parameters, the master data and the planning behavior that produce it. Correct those and the number moves on its own, and it stays moved, which the across-the-board cut never does.
Across more than two decades inside SAP-run businesses, Reveal clients have averaged a 17% increase in inventory turns and a 32% improvement in service levels, and have released more than $1.2B in working capital.
The 12 question self-assessment is a reasonable first read on where your own imbalance is concentrated.


